In the months leading up to the Litecoin halving in August, the price of the blockchain’s native LTC token was continuously on the rise. This renewed interest in investors who rushed back into the token and eventually pushed its price above $100. That is until the actual halving event rolled around, turning it into a “buy the rumor, sell the news” scenario. Since then, it has been a downward spiral for the token and the pain may not be over.
Litecoin Volume Slumps Post-Halving
Litecoin volume since the halving was completed has been less than expected. While investors expected rising demand for the LTC token with the diminished supply rate, the opposite has been the case. Instead, the daily trading volume of the cryptocurrency continued to slump.
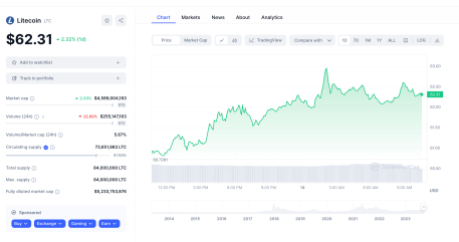
In the last day, the Litceoin daily trading volume fell another 23%. This brought its daily volume to $255 million, a significantly low figure compared to the $500 million daily volumes that the cryptocurrency was recording leading up to the halving.

LTC daily volumes drops 23% | Source: CoinMarketCap
Just like the trading volume, the price of LTC has also plunged significantly. From its pre-halving peak of $112, the altcoin has fallen over 50% to its current level just above $60. This means that the asset has lost all of its gains accumulated between June and July 2023, just one month after the halving was completed.
So rather than being a bullish event as initially expected, the halving has proven to be more bearish than most. It also did not help that it took place during the bear market and LTC has fallen rapidly alongside larger assets such as Bitcoin and Ethereum.
LTC price returns to pre-halving levels | Source: LTCUSD on Tradingview.com
Will LTC Fall Continue To $50?
At the current rate, the forecast does not look too good for the LTC price. Litecoin has understandably seen a 3% increase in the past day as Bitcoin recovered above $26,000. But this does not look sustainable by its current metric.
The first indicator of this is that falling daily trading volume means that interest in the asset is waning. As investors move to other assets they believe provide better prospects, this will affect the LTC price and could trigger further downside from here. Add to this that the coin’s price is below its 50-day and 100-day moving averages and it spells a recipe for disaster.
If LTC bulls are unable to hold support above $60 and it falls once again as it did on September 11, then $50 becomes a very possible landing point. Such a decline would put it back at November 2022 levels and signal a prolonged bear trend for the digital asset.
At the time of writing, LTC price is still sitting above $62 but the tug-of-war for control between bulls and bears continues to rage on.
